JimDoty.org |
||||||||||||||
|
|
||||||||||||||
Support This Site This site in: |
||||||||||||||
|
Lens Testing with the One way to test your own lenses is with
the USAF 1951 lens testing chart. You can find this chart on page 105 in the book SPECIAL PROBLEMS, one of the Time-Life
series of photography books. You can get this book at your
library, or have your library get it on inter-library loan. The following procedure will not give you exact lines per mm resolution, but will allow you to test one lens against another, or compare different
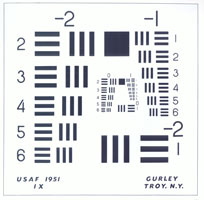
f-stops on the same lens. After obtaining a copy of the chart from the above book (or from the link at the bottom of the page), photocopy the chart. Resize or shrink the test chart "square" down to
about 3 inches by 3 inches in size. Make several copies of the chart and attach them to the center, corners, and edges of a flat piece of foam core, or other flat board, about 24 inches by 36 inches in size. Add
more copies of the chart between the center and edges. Load your camera with a high resolution film like Tech Pan (black and white) or Fuji Velvia slide film. Put your camera and lens on a tripod about one
inch in distance from the chart for every mm of focal length on the lens being tested. For a 50mm lens, you will be 50 inches away. For a 300mm lens, you will be 300 inches away. Do your best to insure that the
film plane is parallel to the plane of your test chart board. Use two flash units at 45 degree angles to the chart as your light source. It is best not to use ambient light due to possible errors from vibration
due to mirror slap. If you must use ambient light, make sure the light level is high enough or low enough that you aren't in the 1/60 to 1/2 second shuuter speed range if you are testing a lens longer than 100mm.
Use some kind of viewfinder magnifier to achieve the most accurate focus possible. Put a removable sticky label on the chart for each lens and aperture in use. Change labels when changing lenses or apertures.
This eliminates confusion later when looking at slides or negatives and wondering which frames were taken with which lens and at what aperture. When you get your processed film back, look at it with a microscope
of about 50X magnification. You can see from the small version of the chart below that the lines are grouped in sets of six, three horizontal and three vertical. Each set of six lines is slightly smaller
than the preceding set. The smaller the lines that are are distinguishable on film, the greater the resolution, or in other words, the sharper the lens is at that aperture. Don't be surprised if the center
chart has sharper lines than the edge charts. Most lenses are sharper in the center of the frame, especially at wide apertures. At small apertures, all lenses get less sharp due to diffraction (bending
of the light as is passes through the small aperture). You will be able to see important differences in sharpness between different lenses at the same aperture, or differences in apertures with the same lens.
The results of your test will not correlate with anyone's published lines per mm results. This procedure is only for comparing results from your own lenses. Focusing errors are the main problem you will
face. After the most carful focusing possible through an eyepiece magnifier, it still helps to bracket focus a little and go by the sharpest frame for that lens and aperture. You can not accurately judge the
results on film with a standard film loup or by projecting the images with a slide projector. You will need a simple microscope that will give you a magnification of about 50x. Simple, inexpensive microscopes are sold by Edmund Scientific. You want the Scientifics catalog. |
|
|


